Group notes
Note 30 Financial risk management
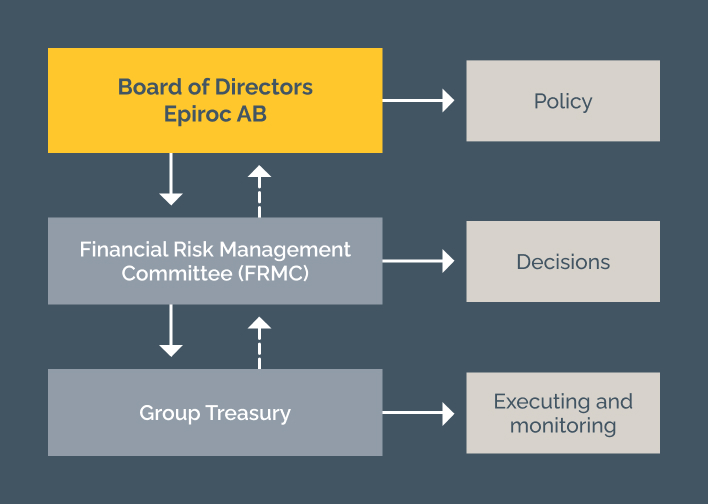
In its operations, Epiroc is exposed to a variety of financial risks: funding and liquidity risk, currency risk, interest rate risk and credit risk. The Board of Directors establishes the Group’s financial risk policy, which includes frameworks, rules and guidelines for how to manage the risks. The financial risk policy is reviewed at least annually. The Group has a financial risk management committee (FRMC), that manage the Group’s financial risks within the mandate from the Board of Directors. The members in the FRMC are the CEO, CFO, Group Treasurer and representative from Group Treasury.
Group Treasury has the operational responsibility for financial risk management in the Group. Group Treasury manages and controls financial risk exposures, ensures that appropriate financing is in place through loans and committed credit facilities and manages the Group’s liquidity.
Group Treasury reports to the FRMC quarterly and the FRMC reports to the Audit Committee.
Capital structure and credit rating
The Group defines capital as borrowings and equity. The capital requirement is assessed based on ratios such as net debt/equity and net debt/EBITDA. Another variable in the assessment of the Group’s capital structure is the credit rating. In May 2025, S&P Global Ratings affirmed the credit rating BBB+ with a stable outlook.
Funding and liquidity risk
Funding and liquidity risk is defined as the risk of the cost being higher and financing opportunities limited as borrowing is renegotiated and payment obligations cannot be met as a result of insufficient liquidity or difficulties in securing funding. The funding and liquidity risk is measured with the following metrics:
| Policy | Limit | 2025 |
|---|---|---|
| Average tenor (long-term) | >3 years | 3.7 |
| Maturities coming 12 months | <5 000 MSEK | 3 564 |
| Committed credit facilities | >4 000 MSEK | 4 000 |
In addition, the policy states that Group should ensure a short-term liquidity reserve, which consists of cash and cash equivalents and uncommitted credit facilities.
Net debt
Net debt is defined by the Group as interest-bearing debt and post-employment benefits, less cash and cash equivalents and certain other financial receivables.
See note 20 and note 22 for more information.
| 2025 | 2024 | |
|---|---|---|
| Interest-bearing liabilities | 21 023 | 22 017 |
| Post-employment benefits | 178 | 201 |
| Cash and cash equivalents | -9 574 | -7 179 |
| Other financial assets | -622 | -262 |
| Net debt | 11 004 | 14 777 |
| Total equity | 42 272 | 43 180 |
| Net debt/equity ratio, % | 26.0 | 34.3 |
| EBITDA | 15 011 | 15 827 |
| Net debt/EBITDA | 0.73 | 0.93 |
The maturity profile of the Group’s financial liabilities is illustrated in the following table. The Group’s short-term liquidity reserve exceeds financial liabilities due within 2026.
| 2025 | 2026 | 2027 | 2028 | 2029 | 2030 | >2030 |
|---|---|---|---|---|---|---|
| Liabilities to credit institutions | 3 368 | 3 516 | 1 905 | 856 | 3 293 | 7 093 |
| Lease liabilities | 778 | 667 | 504 | 343 | 243 | 560 |
| Derivatives | 149 | 5 | - | - | - | - |
| Other liabilities | 11 359 | 69 | - | - | - | - |
| whereof trade payables | 5 683 | - | - | - | - | - |
| Total | 15 654 | 4 257 | 2 409 | 1 199 | 3 536 | 7 653 |
Interest rate risk
Interest rate risk is the risk that changes in market interest rates affect the Group’s net interest. How quickly interest rate changes impact net interest depends on the fixed interest term of the borrowings, including interest rate derivatives. Interest rate risk is measured by duration.
| Policy | Limit | 2025 |
|---|---|---|
| Duration | 6-48 months | 15 |
Comments for the year
The Group’s borrowings have a mix of fixed and floating rates. The floating rates are based on STIBOR, SOFR and BBSW with a credit margin and the borrowings at a floating rate amounted to 9 742 (10 382) at year-end. Borrowings with floating rate amounted to 58 percent of total borrowings. The average interest rate of the Parent Company’s borrowings was 3.75% (4.21). A change by 1 percentage point on the floating interest rates would affect the Group’s interest net by approximately +/- 5 (104).
Currency risk
The Group operates in various geographical markets and undertakes transactions denominated in foreign currencies and is consequently exposed to exchange rate fluctuations. Currency exposure occurs in connection with payments in foreign currency (transaction exposure) and when translating foreign subsidiaries’ balance sheets and income statements into SEK (translation exposure).
Transaction exposure
Transaction exposure primarily arises when the Group’s products are sold in other countries and in other currencies. Sales in each respective market primarily take place in local currency, meaning that Epiroc has a large net inflow of foreign currencies. These payment flows create currency exposures that affect the Group’s earnings in the event of exchange fluctuations.
Policy
The policy states that exposures shall be reduced by matching inflows and outflows of the same currencies. Based on the assumption that currency hedging does not have any significant effect on the Group’s long-term result, the policy recommends leaving transaction exposures unhedged. Divisional management is responsible to adjust operations to compensate for adverse currency movements. However, the FRMC can decide to hedge part of the transaction exposure as well as the purchase price of highly probable acquisitions. Such transactions shall qualify for hedge accounting in accordance with IFRS and hedging beyond 18 months is not allowed. The operational transactional exposure is measured as an estimate of the net foreign exchange flows per currency and is based on both intercompany and external payment flows in the most significant currencies.
Comments for the year
The net amounts for the transaction exposure are shown in the graph below and amounts to 15 570 (16 595). Epiroc is exposed to a large net inflow in many currencies against the SEK and EUR where the Group has its main costs. During the year, a part of the USD transaction exposure was hedged through FX forward contracts. At year-end, no outstanding hedges remained.
The table below shows the effect on pretax earnings that one-sided fluctuations in each currency may have.
| 2025 | 2024 | |
|---|---|---|
| AUD Currency rate +/–1% | 29 | 33 |
| CAD Currency rate +/–1% | 28 | 27 |
| USD Currency rate +/–1% | 37 | 40 |
| SEK Currency rate +/–1% | 137 | 143 |
| ZAR Currency rate +/–1% | 24 | 28 |
| 1) The indication is based on the assumptions that no hedging transactions have been undertaken, and before any impact of offsetting price adjustments or similar measures. | ||
The financial transaction exposure in the Group, i.e., internal and external borrowing or lending in foreign currencies, is centrally managed by Group Treasury. Group Treasury hedges the financial transaction exposure either by FX forwards or by matching inflows and outflows in the same currencies.
Translation exposure
Currency exposure occurs when translating the results and net assets of foreign subsidiaries into SEK, which affects the Group’s income statement and other comprehensive income, respectively, when exchange rates fluctuate.
Policy
The translation exposure is measured as the net of assets and liabilities in a certain currency. The Group’s general policy for managing translation exposure is that translation exposure should be reduced by matching assets and liabilities in the same currencies. The FRMC can decide to hedge part or all of the remaining translation exposure and any hedging shall qualify for hedge accounting in accordance with IFRS.
Comments for the year
During the year, a part of the USD translation exposure was hedged through FX forwards contracts. At year-end, no outstanding hedges remained. See the hedge accounting section for more information. A change up or down by 1% in the value of each currency against the Swedish krona would affect the Group’s pretax earnings by approximately +/– 55 (39).
Credit risk
Credit risk can be divided into operational and financial credit risk. These risks are described further in the following sections. The table shows the total credit risk exposure related to assets classified as financial instruments as of December 31, 2025.
| 2025 | 2024 | |
|---|---|---|
| Receivables | ||
| – trade receivables | 11 155 | 12 424 |
| – finance lease receivables | 723 | 791 |
| – other financial receivables | 2 159 | 2 144 |
| – other receivables | 2 573 | 2 365 |
| – accrued income | 420 | 514 |
| – cash and cash equivalents | 9 574 | 7 179 |
| Derivatives | 688 | 428 |
| Total | 27 292 | 25 845 |
Operational credit risk
Operational credit risk is the risk that the Group’s customers do not meet their payment obligations.
Policy
Since the Group’s sales are distributed among many customers and that no single customer represents a significant share of the Group’s commercial risk, the monitoring of commercial credit risks is primarily performed at the divisional or entity level. Each entity is required to have an approved commercial risk policy. These shall aim to preserve the high credit quality of the Group’s portfolios and thereby protect the Group’s short and long-term viability. The commercial credit risk is measured as the net value of customer receivables. For information about the impairment process, see the section for impairment of financial assets.
Customer finance operation
Epiroc has an in-house customer finance operation, a part of Financial Solutions, as a means of supporting equipment sales. The credit risk in customer financing is typically mitigated by Epiroc Financial Solutions’ maintaining collateral for its credit portfolio primarily through repossession rights in equipment. Entities may also transfer the commercial risk through insurance to external entities, usually to an export credit agency. In addition, Epiroc Financial Solutions also has non-cancelable operating lease contracts, where the residual value is managed through monitoring of equipment with support from customer centers and the customer centers also perform a continuous assessment of the value of the underlying asset. For more information, see note 16 and 23.
Comments for the year
The credit risk is deemed to be limited as the customer receivables relate to a large number of customers, spread across different geographical areas and that a commercial risk policy is applied. At yearend, trade receivables of 11 155 (12 424) were reported, net of impairment amounting to 670 (530). The expected credit losses amounted to 5.7% (4.1) of gross total customer receivables. For more information, see note 18.
The credit risk for the customer finance operation is also diversified as no customer represents more than 6% (6) of the total outstanding receivables. See the table for a distribution of the credit portfolio. Financial Solutions non-cancelable operating lease contracts amounted to 95 (194).
| 2025 | 2024 | |
|---|---|---|
| Trade receivables | 11 | 15 |
| Finance lease receivables | 723 | 792 |
| Other financial receivables | 1 818 | 1 787 |
| Total | 2 552 | 2 594 |
Financial credit risk
Credit risk on financial transactions is the risk that the Group incurs losses as a result of non-payment by counterparties related to the Group’s investments, bank deposits or derivative transactions. The financial credit risk is measured differently depending on transaction type.
Policy
The Group’s policy states that diversification of credit risk should be the norm and that maximum exposure limits shall be assigned for each financial counterparty with a maximum of 3 000 per counterparty. Derivative transactions can only be undertaken with counterparties for which CSA (Credit Support Annex) agreements are established. Furthermore, financial transactions are only to be entered into with counterparties that have a certain rating (not below A3/A-/A-). An investment policy stipulating the framework for investments of the Group’s excess cash shall consider the above points. The policy’s demand for security shall always be prioritized over the aim of maximum return. When measuring credit risk on cash and cash equivalents, the Group applies the general approach on impairment.
Comments for the year
The maturities of the currency derivatives are well below 12 months and the counterparties are stable banks with a high rating. Calculations based on the banks’ probabilities of default, yields an expected loss which is in all respects immaterial. At year-end 2025, the measured credit risk on currency derivatives, taking into account the mark-to-market value and collateral, amounted to 74 (156). The table below presents the reported value of the Group´s derivatives.
| 2025 | 2024 | |
|---|---|---|
| Currency and interest rate derivatives | ||
| Assets | 681 | 421 |
| – whereof net position | 65 | - |
| Liabilities | 144 | 342 |
| – whereof net position | - | 137 |
| Electricity derivatives | ||
| Assets | 7 | 7 |
| Liabilities | 9 | 11 |
No financial assets or liabilities are offset in the balance sheet. Currency and interest rate derivatives are covered by ISDA agreements with a CSA, requiring weekly collateral exchanges based on market values. Net positions may still occur due to timing differences. Electricity derivatives are not subject to ISDA agreements.
Commodity and electricity price risk
Commodity price risk is the risk that the cost of direct and indirect materials could increase as underlying commodity prices rise in global markets.
Policy
The Group is directly and indirectly exposed to price fluctuations of raw materials and electricity. Cost increase for raw materials and components frequently coincide with strong end-customer demand and are offset by increased sales to mining customers and compensated for by increased market prices. Therefore, the Group does not hedge commodity price risks on a regular basis. However, the Operations may decide to hedge part of the commodity risk and if so, the hedging shall be approved by Group Treasury and qualify for hedge accounting. Hedging beyond 60 months is not allowed.
Comments for the year
Part of the electricity price risk in the Swedish production facilities is hedged up to five years, managed through a discretionary management mandate. The remaining part of the electricity price risk is measured by the divisions as part of cost of sales. For more information, see the hedge accounting section.
Hedge accounting
ACCOUNTING POLICY
The Group applies hedge accounting to hedge FX risk, interest rate risk and electricity price risk. Epiroc applies a mix of cash flow hedging, fair value hedging and net investment hedging. To apply hedge accounting, hedge relationships must be formally identified and documented. In addition, there needs to be an economic relationship between the hedged item and the hedging instrument, the effect of credit risk may not dominate the value changes resulting from that relationship, and the hedge ratio is the same as that resulting from the quantity of both the hedged item and the hedging instrument used.
The economic relationships are assessed based on a qualitative analysis of critical terms, which are matched. As such, the carrying amounts are expected to move in opposite directions as a result of a change in the hedged risk. The effects of credit risk are not considered to dominate the changes in fair value. The hedge ratios applied by Epiroc is 1:1. The potential sources of ineffectiveness are related to changes in Epiroc’s or the counterparty’s credit risk and valuation changes in floating legs from swaps designated as hedging instruments. Any ineffectiveness is recognized in profit or loss.
Epiroc uses derivatives as hedging instruments for hedge accounting, either by themselves or in combination with other offsetting derivatives. The derivatives can be designated in one or more hedging relationships. If a derivative is used in multiple hedging relationships, it is bifurcated to achieve hedge accounting. Subsequently, the bifurcated derivatives are identified as hedging instruments. Any reference below to derivatives are the hedging instruments used for hedge accounting.
The following table shows the maturity of the hedging instruments:
| 2025 | <1 year | 1-5 years | >5 years | Total |
|---|---|---|---|---|
| Electricity derivatives | 54 | 46 | 100 | |
| – Average forward rate (GWH) | 0.48 | 0.44 | ||
| Cross-currency interest rate swaps | 5 398 | 5 398 | ||
| – Average fixed interest | 3.63 | 3.63 | ||
| Interest rate swaps | 2 511 | 2 511 | ||
| – Average fixed interest | 5.15 | 5.15 |
Cash flow hedge
Epiroc applies cash flow hedging on foreign currency exposures and electricity price exposures. The strategies are to hedge part, or all, of the identified exposures:
- A portion, approximately 15%, of the foreign currency transaction exposure from future sales in USD has been hedged with FX forward contracts up to one year. Sales in foreign currency is designated as the hedged risk.
- Foreign currency issued debt is hedged with a cross-currency interest rate swap that converts EUR borrowing to SEK.
- Most of the electricity price risk in the Swedish production facilities is hedged up to five years through a discretionary management mandate. 90% of the estimated electricity consumption is hedged with a declining linear basis to 0 percent in year 4.
The effective portion of any gains or losses on the hedging instrument is recognized in other comprehensive income and is reclassified to profit or loss when the hedged item impact profit and loss. Changes in foreign currency basis spread is recognized in cost of hedging in other comprehensive income.
Net investment hedge
Epiroc also applies hedges of net investments in foreign operations. The strategy is to hedge part of the USD currency risk of Epiroc’s net investment in foreign operations using cross-currency interest rate swaps. The hedged risk is the FX spot rate. Gains or losses on the hedging instrument relating to the effective portion of the hedge are recognized in other comprehensive income, while any gains or losses relating to the ineffective portion are recognized in profit or loss. On disposal of the foreign operation, the cumulative value of any such gains or losses recorded in equity is transferred to profit or loss. Changes in forward element and foreign currency basis spread is recognized in cost of hedging in other comprehensive income.
The table shows impact of cash flow hedging and net investment hedging on the statement of financial position as of 31 December 2025.
| 2025 | Change in value used for measuring ineffectiveness for the period | ||||||||
|---|---|---|---|---|---|---|---|---|---|
| Hedging instruments | Nominal amount | Carrying amount | Hedging instrument | Hedged item | Hedge ineffectiveness recognised in the income statement | Balance in Cash flow Hedge reserve | Balance in Foreign currency translation reserve | Balance in cost of hedging reserve | Re-classified into profit or loss |
| Cash flow Hedge | |||||||||
| – FX Forward contracts | – | – | – | – | – | – | – | – | – |
| – Cross-currency interest rate swaps | 2 798 | -57 | -99 | 99 | – | -99 | – | -6 | -99 |
| – Electricity derivatives | 100 GWh | -2 | -2 | 2 | – | -2 | – | – | 4 |
| Net investment Hedge | |||||||||
| – Cross-currency | 5 664 | -14 | 786 | -786 | – | – | 786 | -76 | – |
| 2024 | Change in value used for measuring ineffectiveness for the period | ||||||||
| Hedging instruments | Nominal amount | Carrying amount | Hedging instrument | Hedged item | Hedge ineffectiveness recognised in the income statement | Balance in Cash flow Hedge reserve | Balance in Foreign currency translation reserve | Balance in cost of hedging reserve | Re-classified into profit or loss |
| Cash flow Hedge | |||||||||
| – FX Forward contracts | 99 | 0 | 0 | -0 | – | -0 | – | – | 39 |
| – Cross-currency interest rate swaps | 2 798 | -112 | 68 | -68 | – | 68 | – | -246 | 68 |
| – Electricity derivatives | 103 GWh | 45 | -49 | 45 | – | -4 | – | – | – |
| Net investment Hedge | |||||||||
| – Cross-currency | 5 664 | -190 | -214 | 214 | – | – | -214 | 252 | – |
Any ineffectiveness is recognized in net financial items in the income statement. The hedging instruments are recognized on the line other assets or other liabilities in the statement of financial position. The table shows a reconciliation of each component of equity and the analysis of other comprehensive income resulting from hedge accounting:
| 2025 | Cash flow Hedge reserve | Cost of Hedging reserve | Foreign currency translation reserve |
|---|---|---|---|
| Opening balance, Jan. 1 | -3 | 5 | – |
| Effective changes in fair value from hedging instruments | |||
| – FX forward contracts | – | – | – |
| – Cross-currency interest rate swaps | -99 | -82 | -786 |
| – Electricity derivatives | -2 | – | – |
| Foreign currency revaluation of the net foreign operations | – | – | 786 |
| Amount reclassified to the income statement | 95 | – | – |
| Tax | 2 | 16 | – |
| Closing balance, Dec. 31 | -7 | -61 | 0 |
| 2024 | Cash flow Hedge reserve | Cost of Hedging reserve | Foreign currency translation reserve |
| Opening balance, Jan. 1 | 39 | 0 | – |
| Effective changes in fair value from hedging instruments | |||
| – FX forward contracts | 0 | – | – |
| – Cross-currency interest rate swaps | 68 | 6 | -214 |
| – Electricity derivatives | -4 | – | – |
| Foreign currency revaluation of the net foreign operations | – | – | 214 |
| Amount reclassified to the income statement | -107 | – | – |
| Tax | 1 | -1 | – |
| Closing balance, Dec. 31 | -3 | 5 | 0 |
Fair Value Hedge
Epiroc applies fair value hedging on foreign currency exposures and interest rate exposures. The strategy is to hedge part of EUR spot risk and the benchmark interest rate risk exposure of Epiroc’s fixed foreign currency debt using cross-currency interest rate swaps. The hedged item’s and hedging instrument’s changes in fair value, related to changes in currency and interest rates, are recognized in the income statement within net financial items in the statement of financial position. Changes in foreign currency basis spread is recognized in cost of hedging in other comprehensive income.
The table shows impact of hedge accounting on the statement of financial position and hedge ineffectiveness as of 31 December 2025.
| Hedging instruments | Classification | Nominal amount | Carrying amount | Change in fair value used for measuring ineffectiveness |
|---|---|---|---|---|
| EUR denominated debt | Hedged item | 2 679 | 2 678 | 44 |
| Cross-currency interest rate swaps | Hedged instrument | 2 798 | -125 | -76 |
| Ineffectiveness recognized in Profit or loss | -33 | |||
| Accumulated change | -55 |
Any ineffectiveness is recognized in net financial items in the income statement. The hedging instruments are recognized on the line other assets or other liabilities in the statement of financial position.